Open Distro for Elasticsearch Kickstart guide


Recently Updated 14th June 2020 - Now supports up to version 1.8.0 of Open Distro
Open Distro for Elasticsearch is a very recent fork of Elasticsearch by Amazon that aims to distribute a version with enhanced features that you'd traditionally have to pay for with Elasticsearch.
Some of these open sourced features are available today:
- Security & Authentication (Kibana & Elasticsearch)
- Alerting (Monitoring & Triggers)
- SQL Queries
- perftop (Performance monitoring for stack)
There's also a decent explanation as to why Amazon is going down this path, a key line to take away:
As was the case with Java and OpenJDK, our intention is not to fork Elasticsearch, and we will be making contributions back to the Apache 2.0-licensed Elasticsearch upstream project as we develop add-on enhancements to the base open source software.
Adrian Cockcroft - Keeping Open Source Open – Open Distro for Elasticsearch
Purpose
The purpose of this guide is to give a really streamlined introduction to Open Distro for Elasticsearch and extend the examples on the website to include a small example to prove that all our usual features from elastic are intact.
Nothing I do within this guide is exceptionally unique in terms of actual configuration of Open Distro for Elasticsearch however I believe applying a practical example when trying to learn a new tool is really important! All the code we'll be using can be found in t04glovern/open-distro-kickstart
Outcome
By the end of this post you'll have setup a simple multi node cluster of Elasticsearch nodes and a Kibana frontend that will be used to view interesting data about a podcast I'm quite fond of called The Dollop.
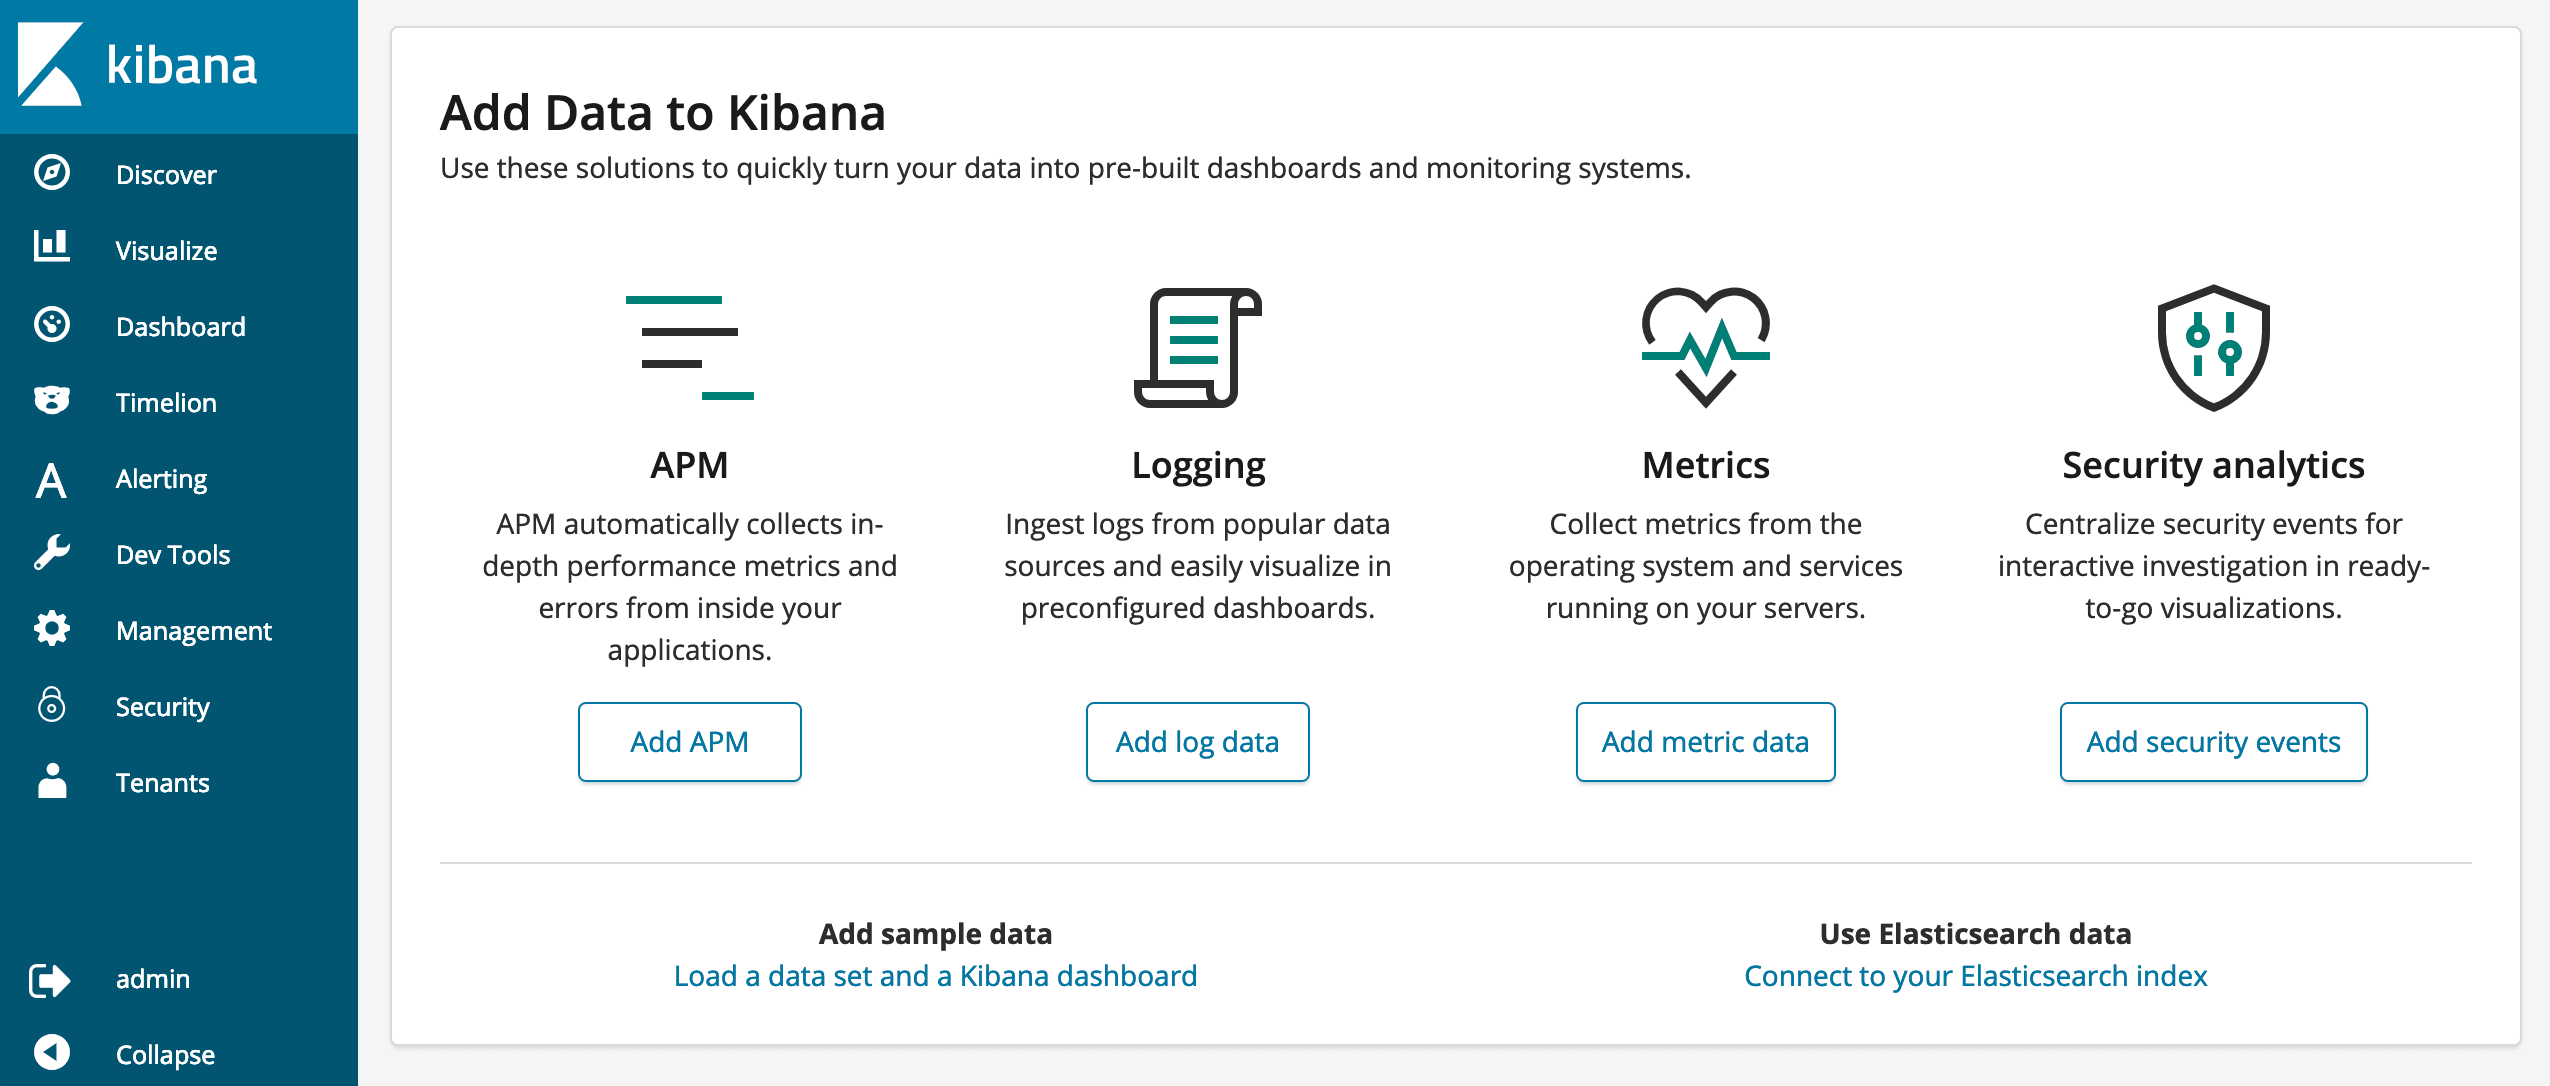
Open Distro Dockerized
You'll need Docker installed on the system you're working with so download the Community Edition and install that to begin with. Also pull down a copy of the demo repository t04glovern/open-distro-kickstart using the following git commands
git clone https://github.com/t04glovern/open-distro-kickstartNext we're going to run docker-compose to bring up three different containers for us that are defined in the docker-compose.yml file.
version: '3'

services:

  odfe-node1:
    image: amazon/opendistro-for-elasticsearch:1.8.0
    container_name: odfe-node1
    environment:
      - cluster.name=odfe-cluster
      - node.name=odfe-node1
      - discovery.seed_hosts=odfe-node1,odfe-node2
      - cluster.initial_master_nodes=odfe-node1,odfe-node2
      - bootstrap.memory_lock=true # along with the memlock settings below, disables swapping
      - "ES_JAVA_OPTS=-Xms512m -Xmx512m" # minimum and maximum Java heap size, recommend setting both to 50% of system RAM
    ulimits:
      memlock:
        soft: -1
        hard: -1
      nofile:
        soft: 65536 # maximum number of open files for the Elasticsearch user, set to at least 65536 on modern systems
        hard: 65536
    volumes:
      - odfe-data1:/usr/share/elasticsearch/data
    ports:
      - 9200:9200
      - 9600:9600 # required for Performance Analyzer
    networks:
      - odfe-net

  odfe-node2:
    image: amazon/opendistro-for-elasticsearch:1.8.0
    container_name: odfe-node2
    environment:
      - bootstrap.memory_lock=true
      - cluster.initial_master_nodes=odfe-node1,odfe-node2
      - cluster.name=odfe-cluster
      - discovery.seed_hosts=odfe-node1,odfe-node2
      - "ES_JAVA_OPTS=-Xms512m -Xmx512m"
      - node.name=odfe-node2
    ulimits:
      memlock:
        soft: -1
        hard: -1
      nofile:
        soft: 65536
        hard: 65536
    volumes:
      - odfe-data2:/usr/share/elasticsearch/data
    networks:
      - odfe-net

  kibana:
    image: amazon/opendistro-for-elasticsearch-kibana:1.8.0
    container_name: odfe-kibana
    ports:
      - 5601:5601
    expose:
      - "5601"
    environment:
      ELASTICSEARCH_URL: http://odfe-node1:9200
      ELASTICSEARCH_HOSTS: https://odfe-node1:9200
    networks:
      - odfe-net

volumes:
  odfe-data1:
  odfe-data2:

networks:
  odfe-net:
This file above is much like the one from the tutorial on the Open Distro for Elasticsearch website however a couple lines have been added to improve usability while we're loading data in; specifically:
- ELASTICSEARCH_URL: http://odfe-node1:9200 - similarly we've changed the https to http in the url definition for Kibana.
NOTE: this is NOT good practice, and should never be done in production or work environments.
Deploy the docker images using the following command from within the repo folder
docker-compose up -dNOTE: If your cluster fails to start you might need to increaase the max virtual memory using the following.
sudo sysctl -w vm.max_map_count=262144NOTE: If you are on Windows, will need to increase the memory allocated to Docker to at least 4G. You can do this under the Docker settings
Running docker ps -a should result in being able to see all three containers up and running after about 30 seconds.
PORTS                                                      NAMES
9200/tcp, 9300/tcp, 9600/tcp                               odfe-node2
0.0.0.0:5601->5601/tcp                                     odfe-kibana
0.0.0.0:9200->9200/tcp, 0.0.0.0:9600->9600/tcp, 9300/tcp   odfe-node1
Open up http://localhost:5601 and login with the default credentials admin:admin
perftop - Monitoring
Before diving into our Elasticsearch stack too much we'll have a go at setting up the monitoring tool perftop with our ES instance. I've written a short line for either MacOS or Linux that can be run in order to pull down a copy of the binary for use in this tutorial.
## MacOS
wget https://d3g5vo6xdbdb9a.cloudfront.net/downloads/perftop/perf-top-1.8.0.0-MACOS.zip && \
    unzip perf-top-1.8.0.0-MACOS.zip && \
    rm perf-top-1.8.0.0-MACOS.zip

## Linux
wget https://d3g5vo6xdbdb9a.cloudfront.net/downloads/perftop/perf-top-1.8.0.0-LINUX.zip && \
    unzip perf-top-1.8.0.0-LINUX.zip && \
    rm perf-top-1.8.0.0-LINUX.zip
Then simply run one of the following commands in order to view one of the four dashboards.
# MacOS: perf-top-macos | Linux: perf-top-linux
./perf-top-${os} --dashboard ClusterNetworkMemoryAnalysis   --endpoint localhost:9600
./perf-top-${os} --dashboard ClusterOverview                --endpoint localhost:9600
./perf-top-${os} --dashboard ClusterThreadAnalysis          --endpoint localhost:9600
./perf-top-${os} --dashboard NodeAnalysis --endpoint localhost:9600Note: If you get the following error, run the commands with the TERM=xterm prefix
# Error: File '/**/perftop/node_modules/blessed/usr/xterm' was not included into executable at compilation stage. Please recompile adding it as asset or script
TERM=xterm ./perf-top-${os} --dashboard ClusterNetworkMemoryAnalysis   --endpoint localhost:9600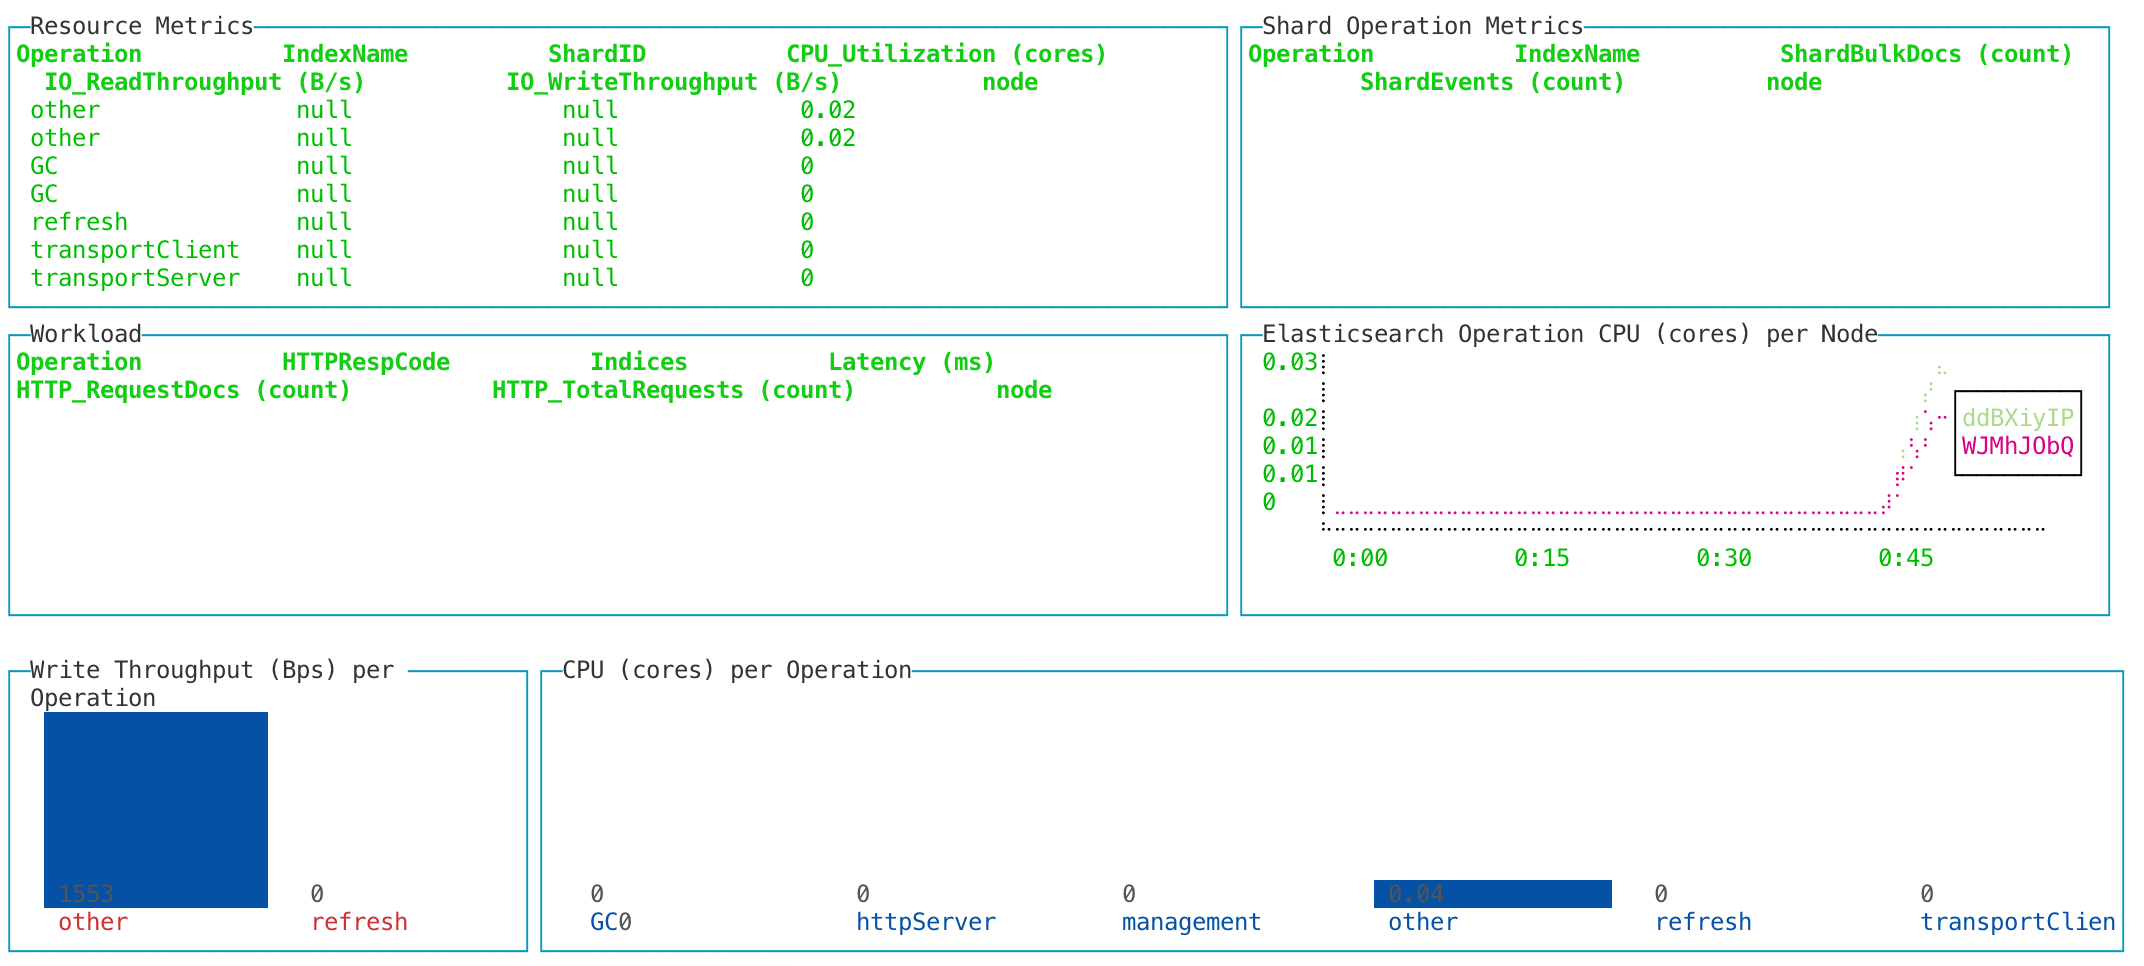
The Dollop Data
Now that the cluster is up, lets load in a nice dataset to work with. I've actually developed one myself using a great tutorial last year called Discovering and indexing podcast episodes using Amazon Transcribe and Amazon Comprehend. The outcome of that is the data found in es_dollop within the project.
To load in this data, we'll use elasticdump which can be easily installed using npm via the following:
npm install elasticdump -gThen run the following commands in order to load in the data & mappings.
NODE_TLS_REJECT_UNAUTHORIZED=0 elasticdump \
--input=es_dollop/dollop_episode_mapping.json \
--output=https://admin:admin@localhost:9200/episodes \
--type=mapping
NODE_TLS_REJECT_UNAUTHORIZED=0 elasticdump \
--input=es_dollop/dollop_episode.json \
--output=https://admin:admin@localhost:9200/episodes \
--type=data
NODE_TLS_REJECT_UNAUTHORIZED=0 elasticdump \
--input=es_dollop/dollop_paragraph_mapping.json \
--output=https://admin:admin@localhost:9200/paragraphs \
--type=mapping
NODE_TLS_REJECT_UNAUTHORIZED=0 elasticdump \
--input=es_dollop/dollop_paragraph.json \
--output=https://admin:admin@localhost:9200/paragraphs \
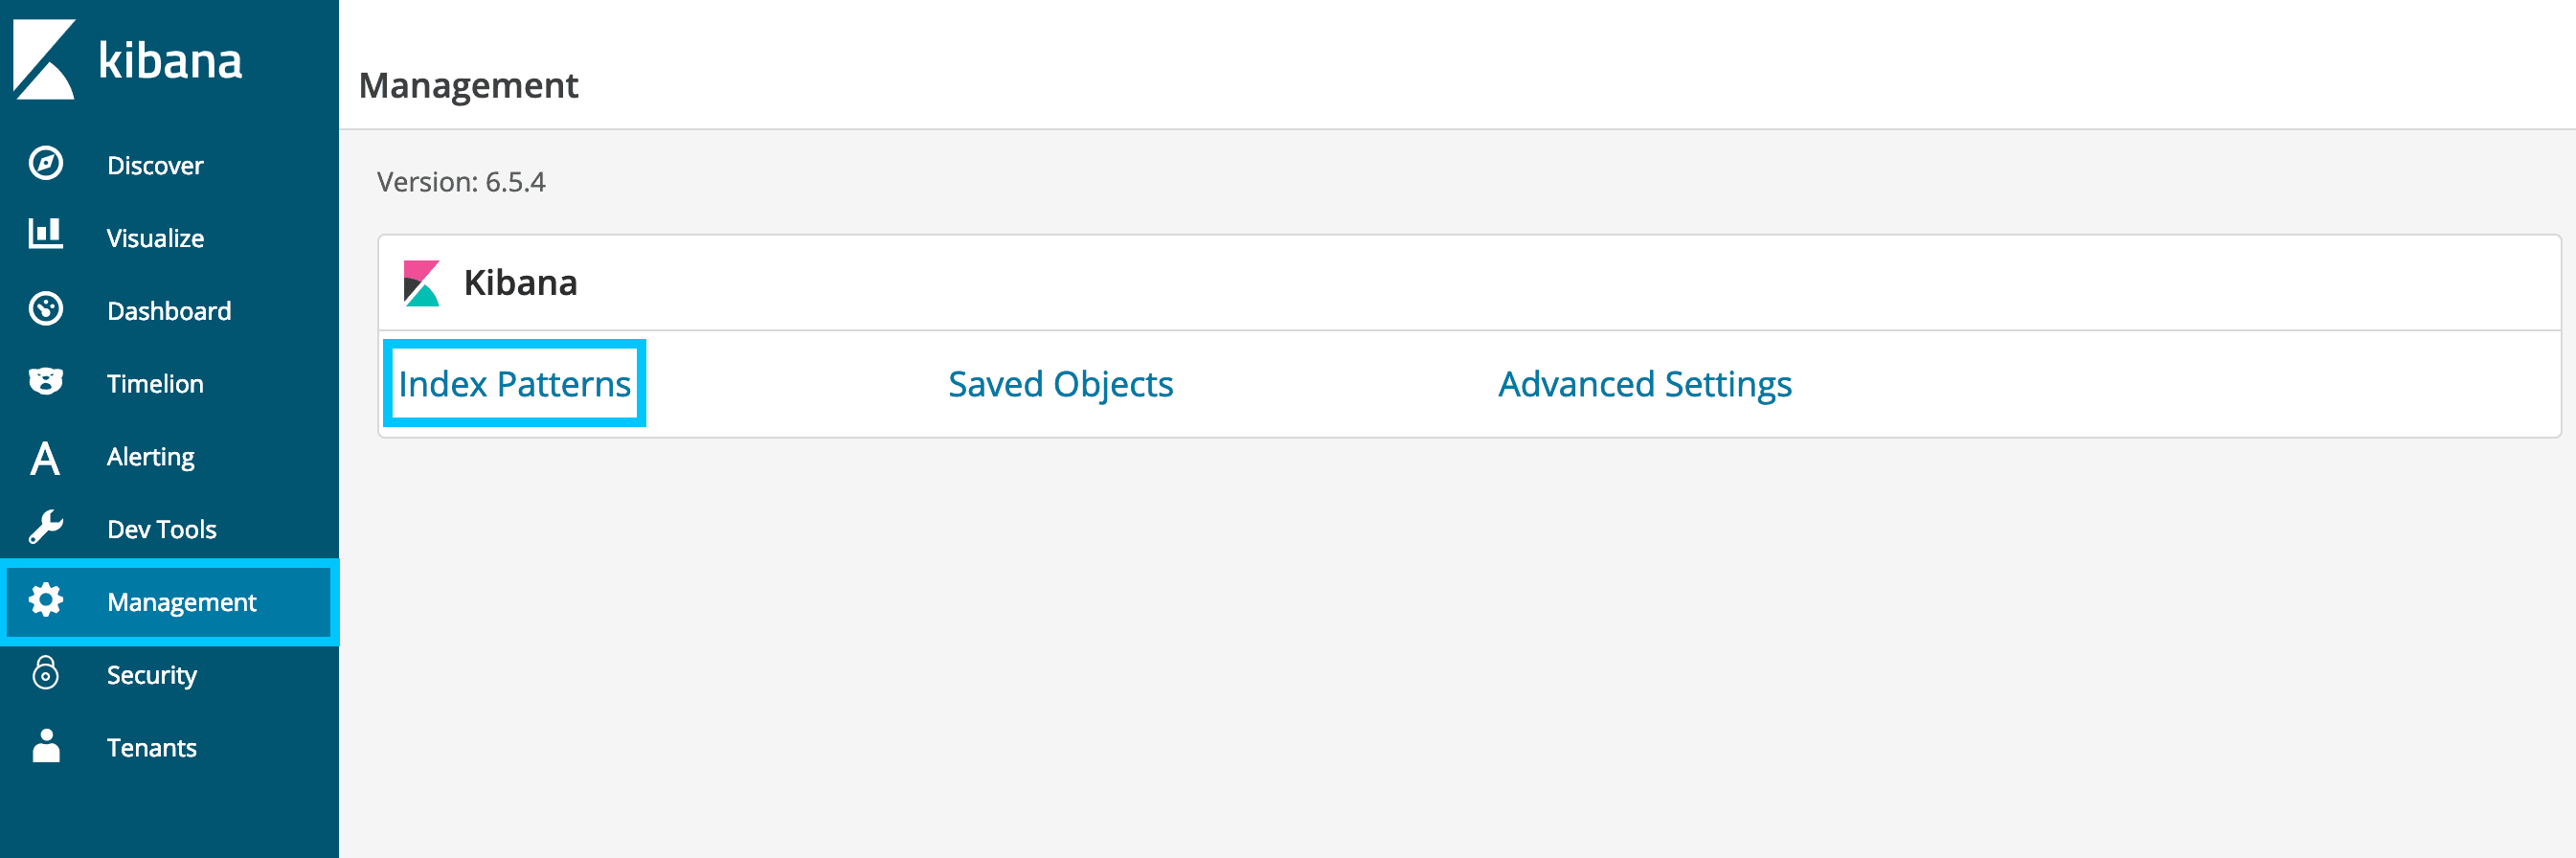
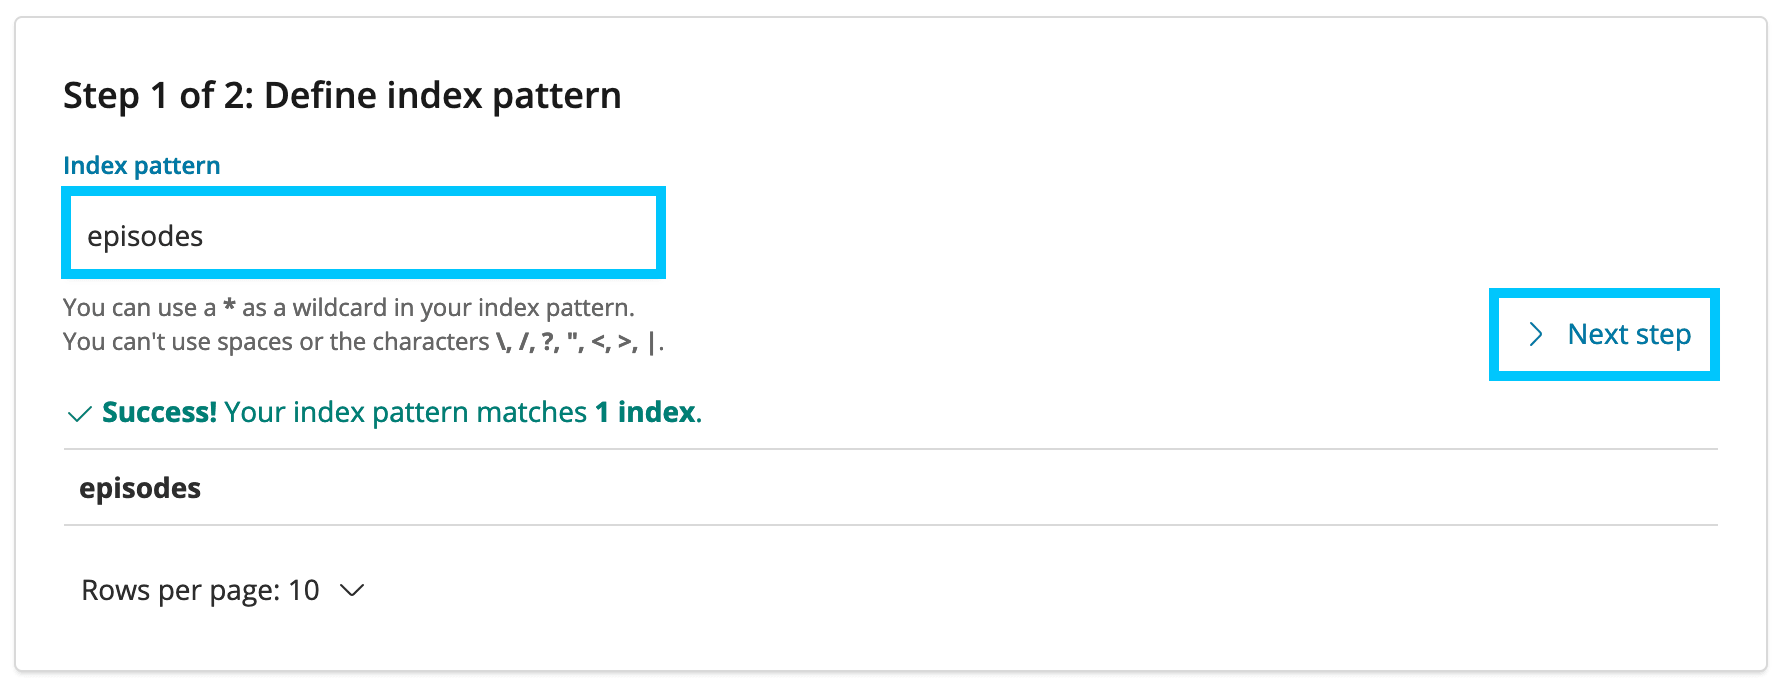
--type=dataHead back to Kibana and add two new index patterns by clicking Management then Index Patterns
Create the episodes index
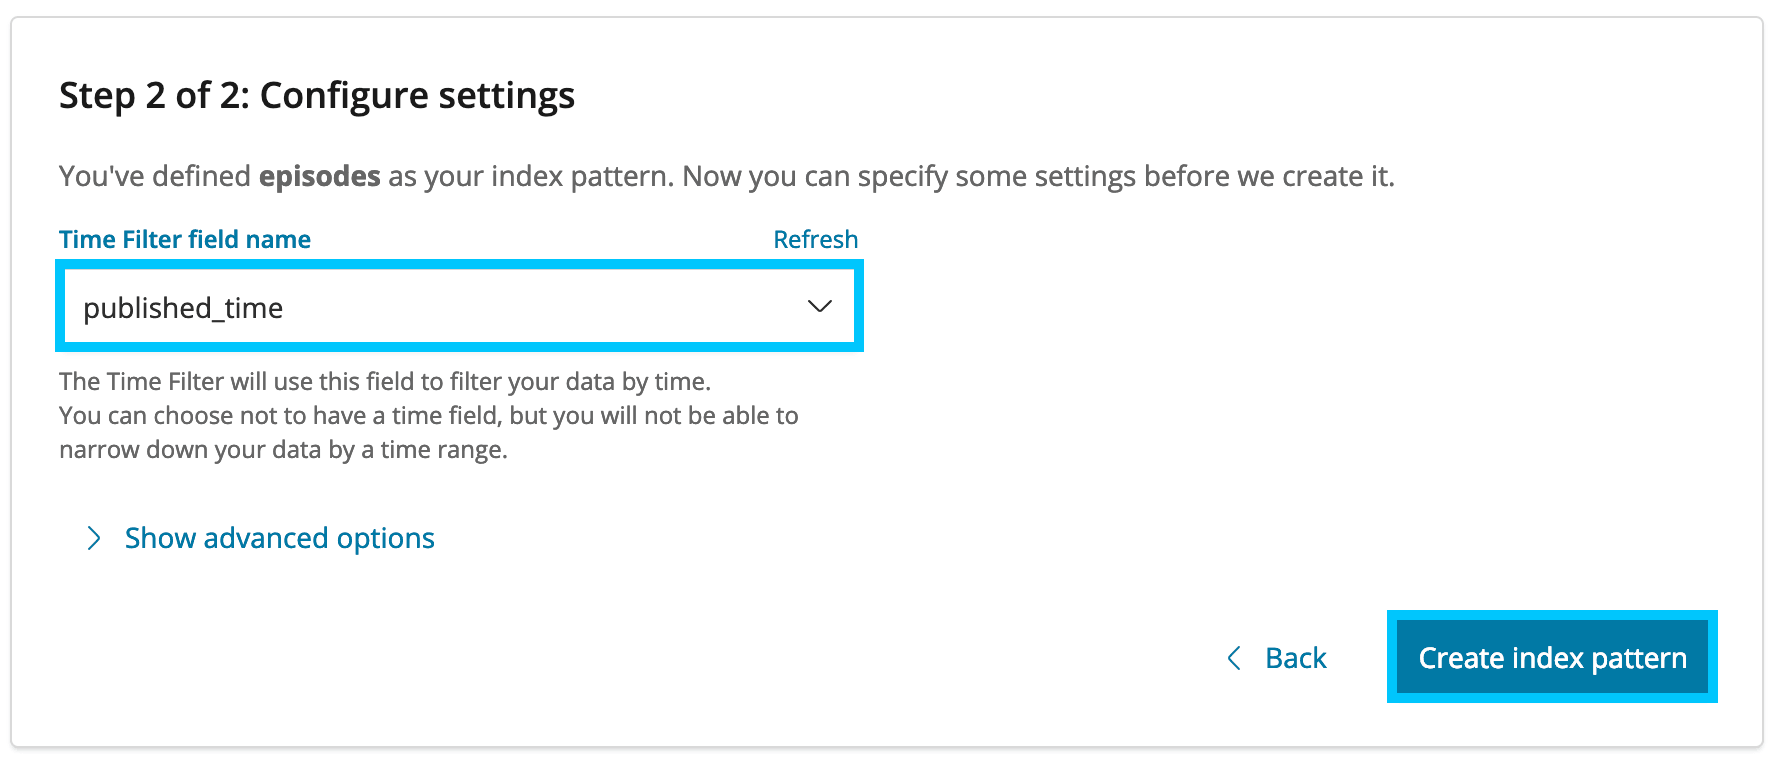
Set the Time Filter to be published_time
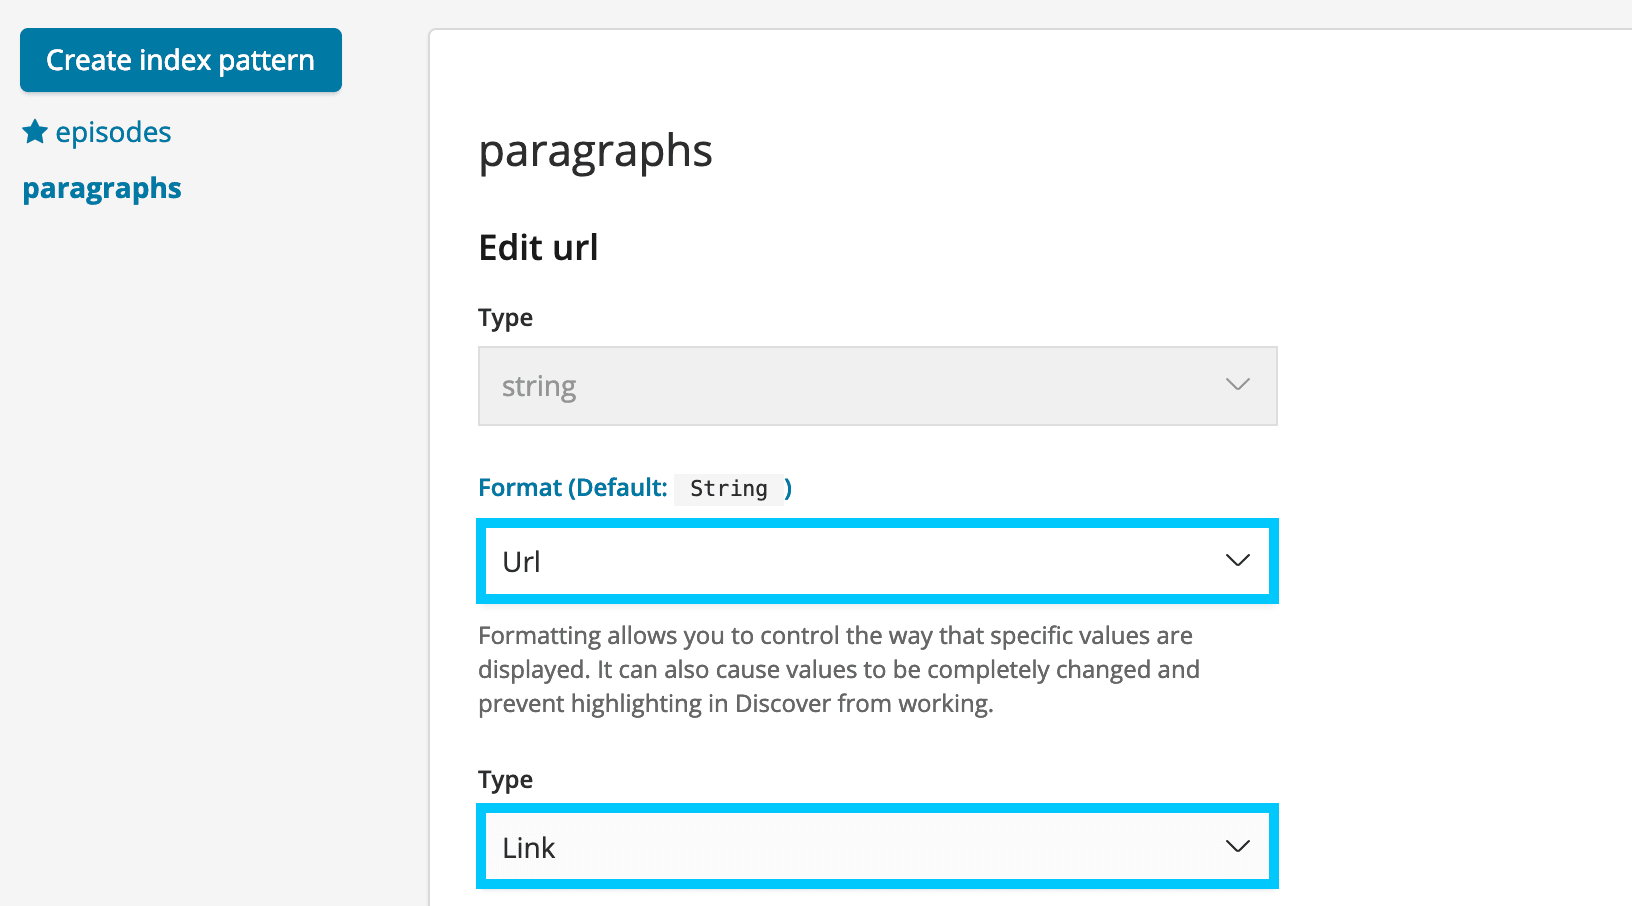
Perform the same actions again but for paragraphs, also ensure to set the URL field to Link
- Navigate to Management -> Index Patterns -> Create Index.
- In the index pattern textbox, type paragraphs, then choose Next Step.
- Accept the defaults and choose Create Index Pattern.
- Scroll down to the Url field and choose the edit icon on the right.
- Set the Format to Url, and the type to Link. Then choose Update Field
Kibana Dashboard
Load in a new dashboard by clicking Saved Objects under Management. Then click Import
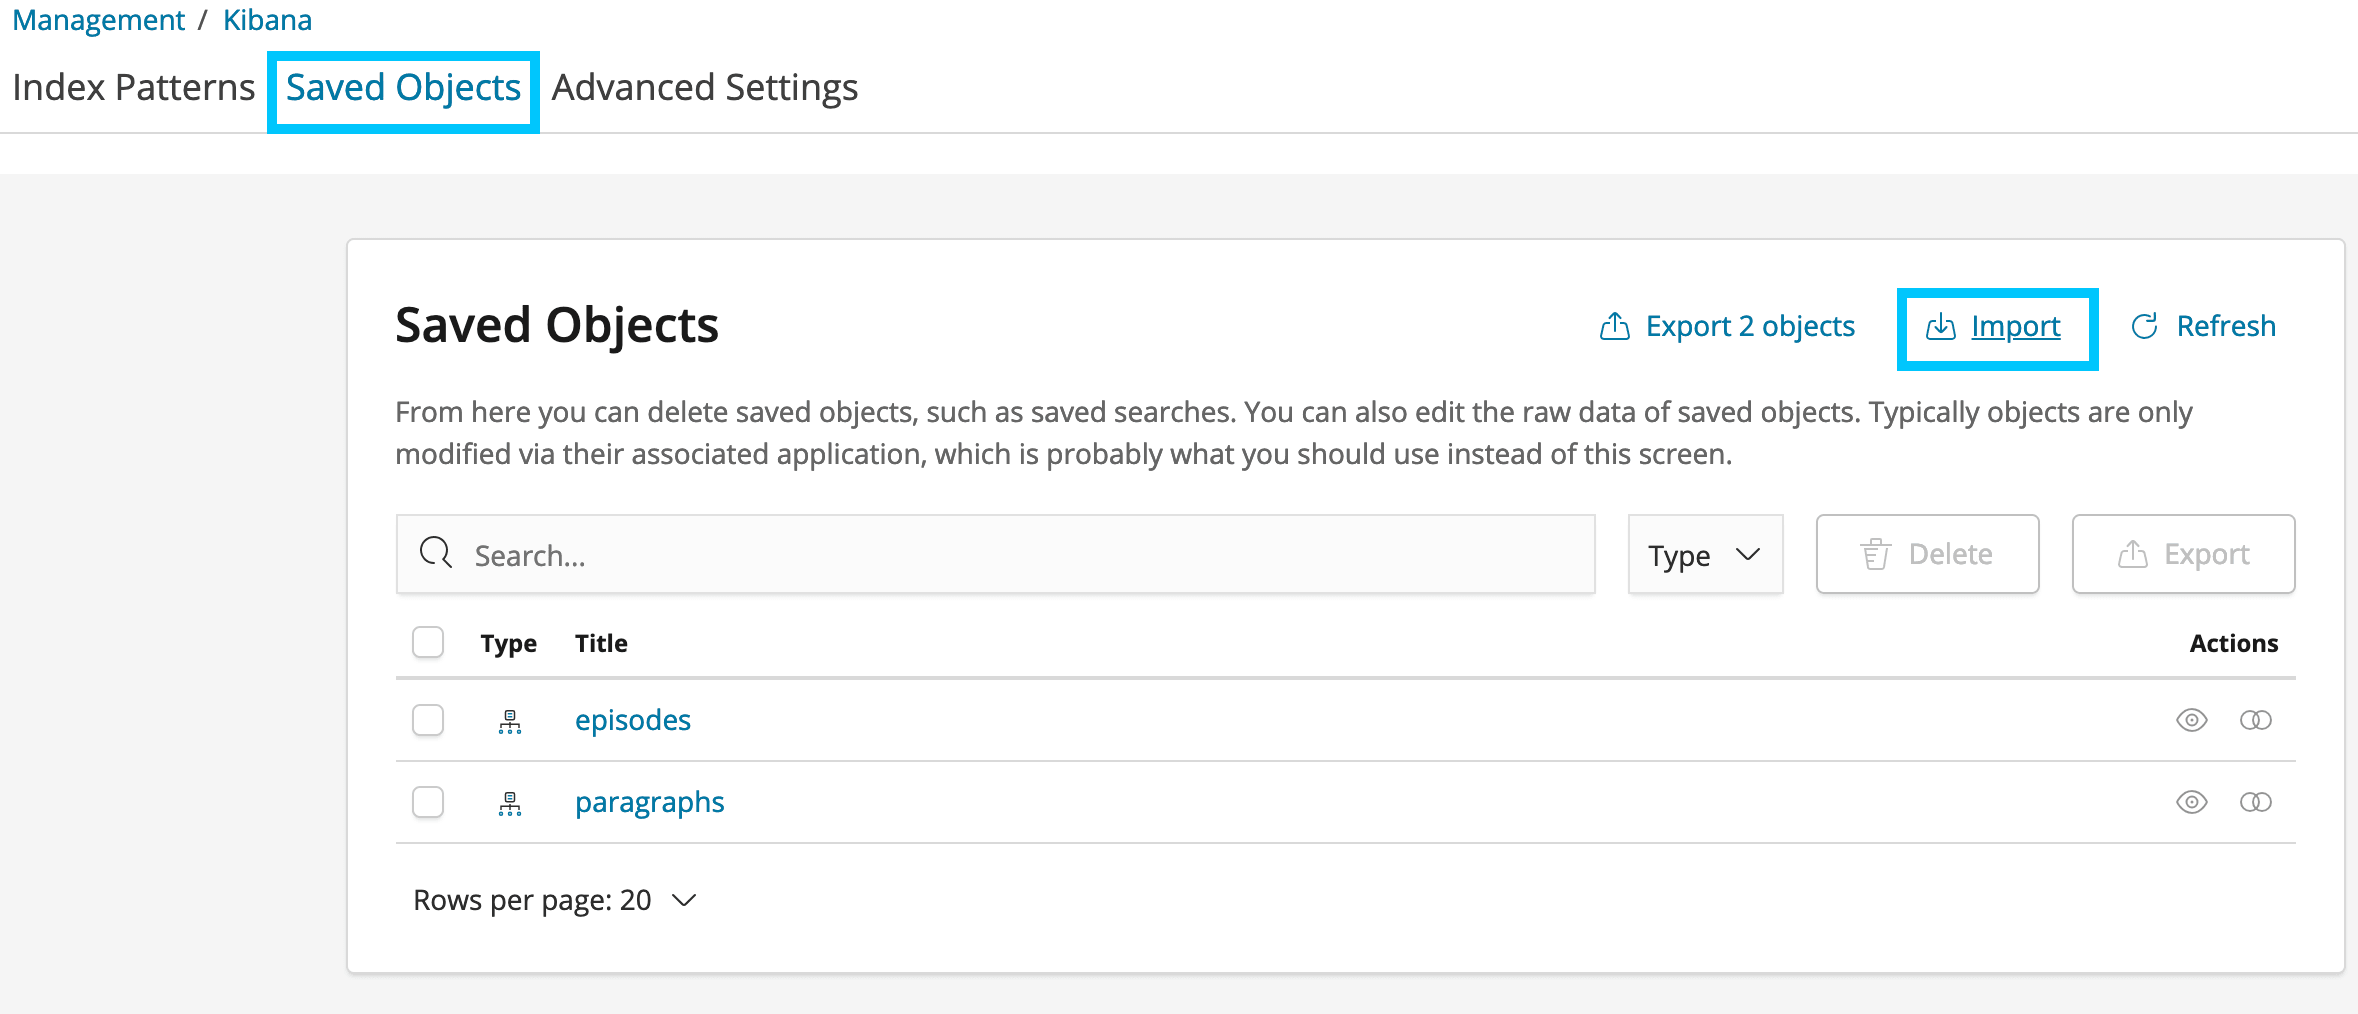
Select es_dollop/dashboard.json from the repo folder and click Import
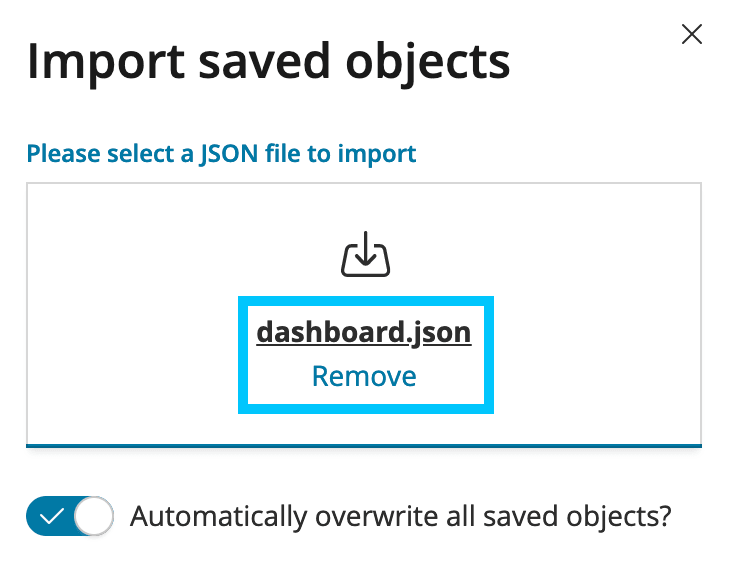
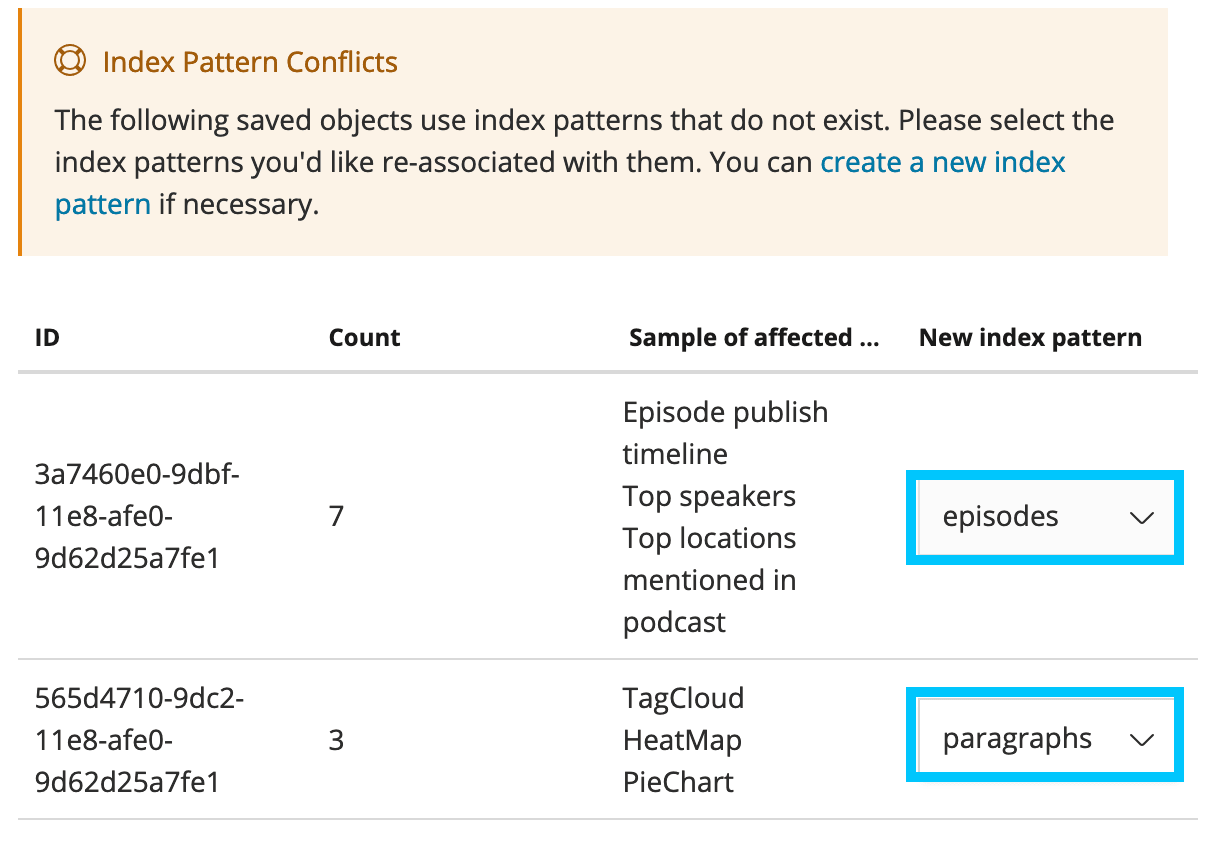
If you get an error just make sure you assign episodes and paragraphs to the right sets and hit confirm
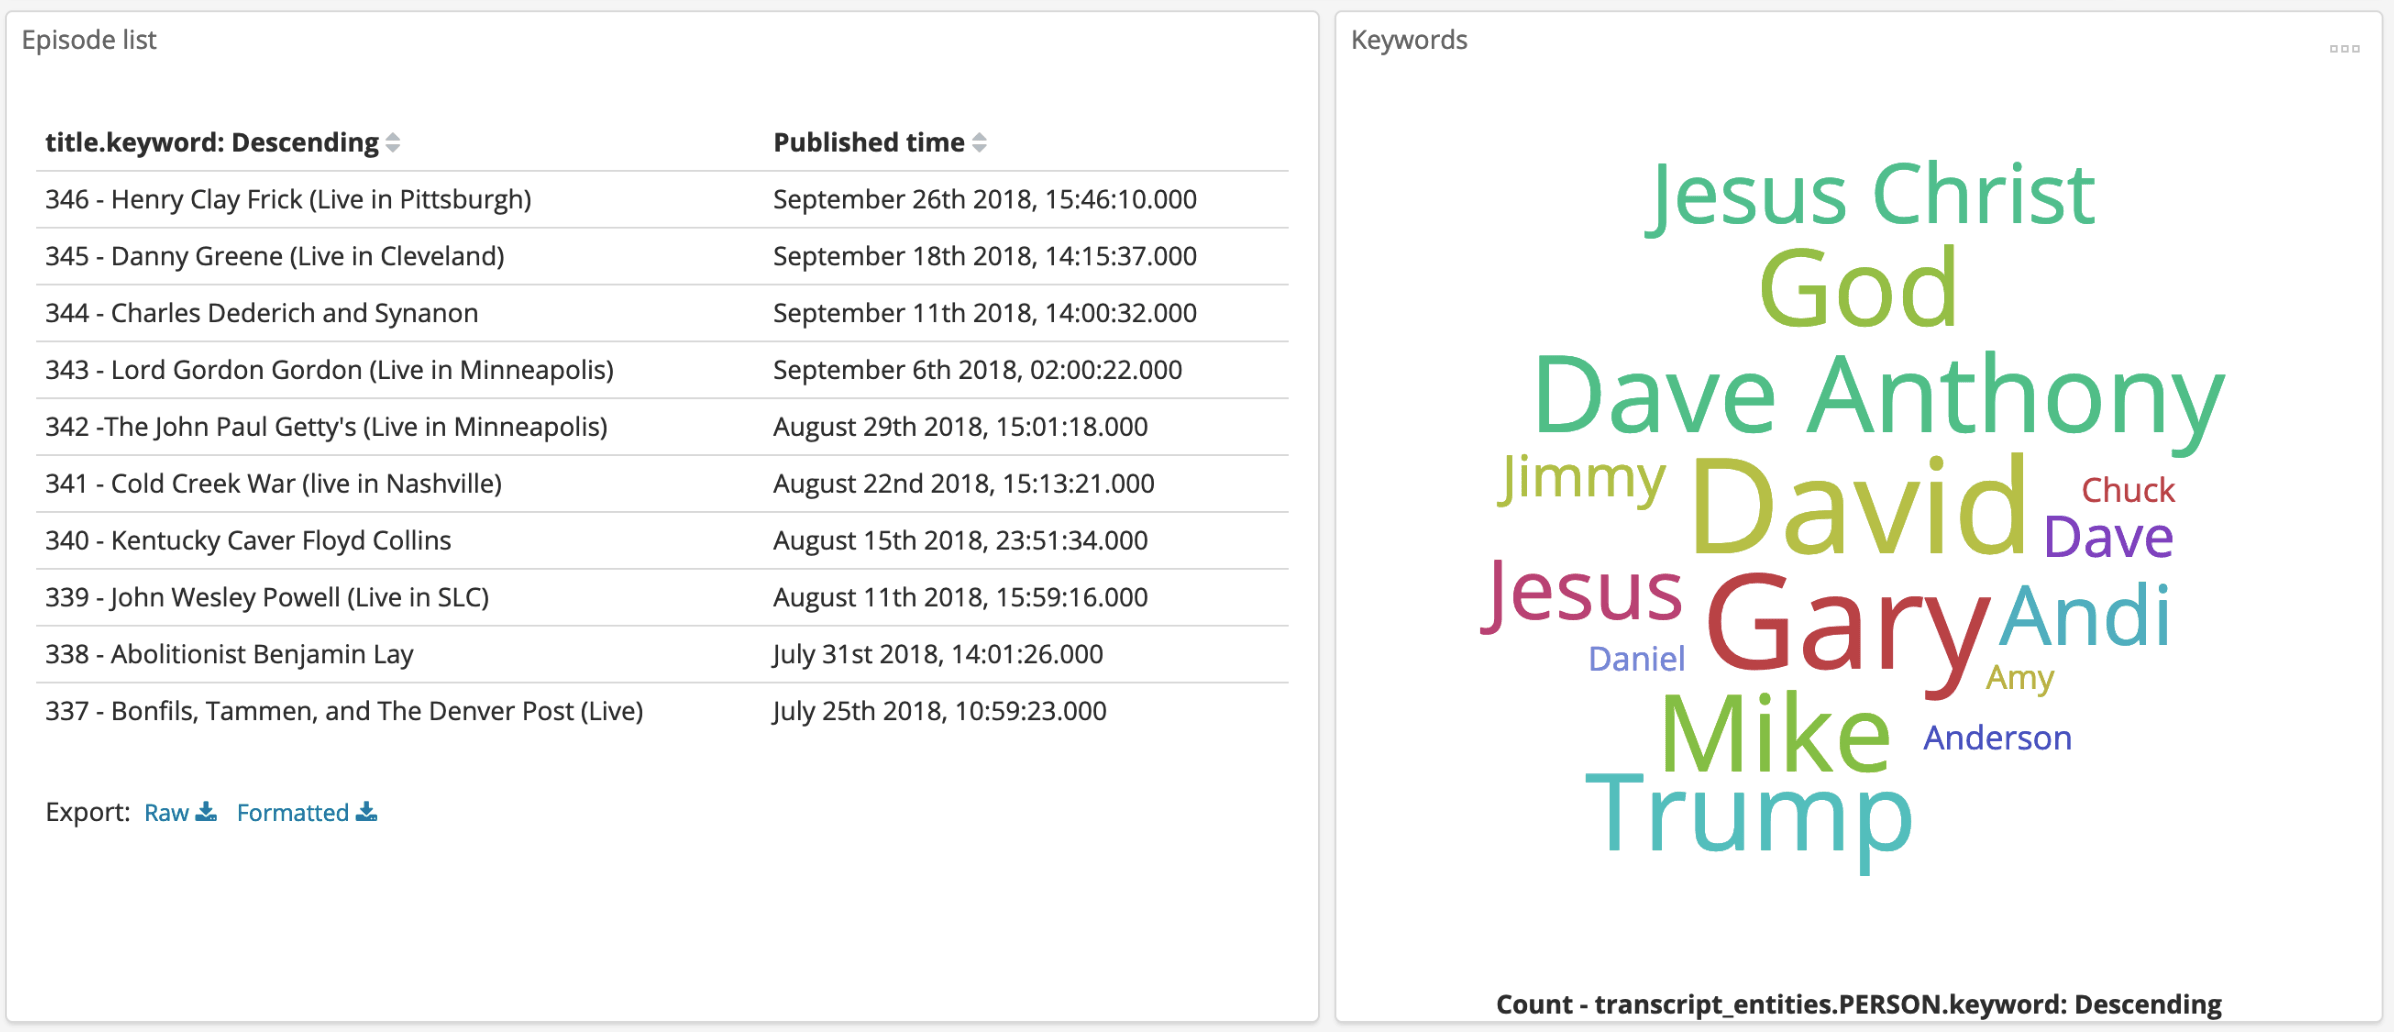
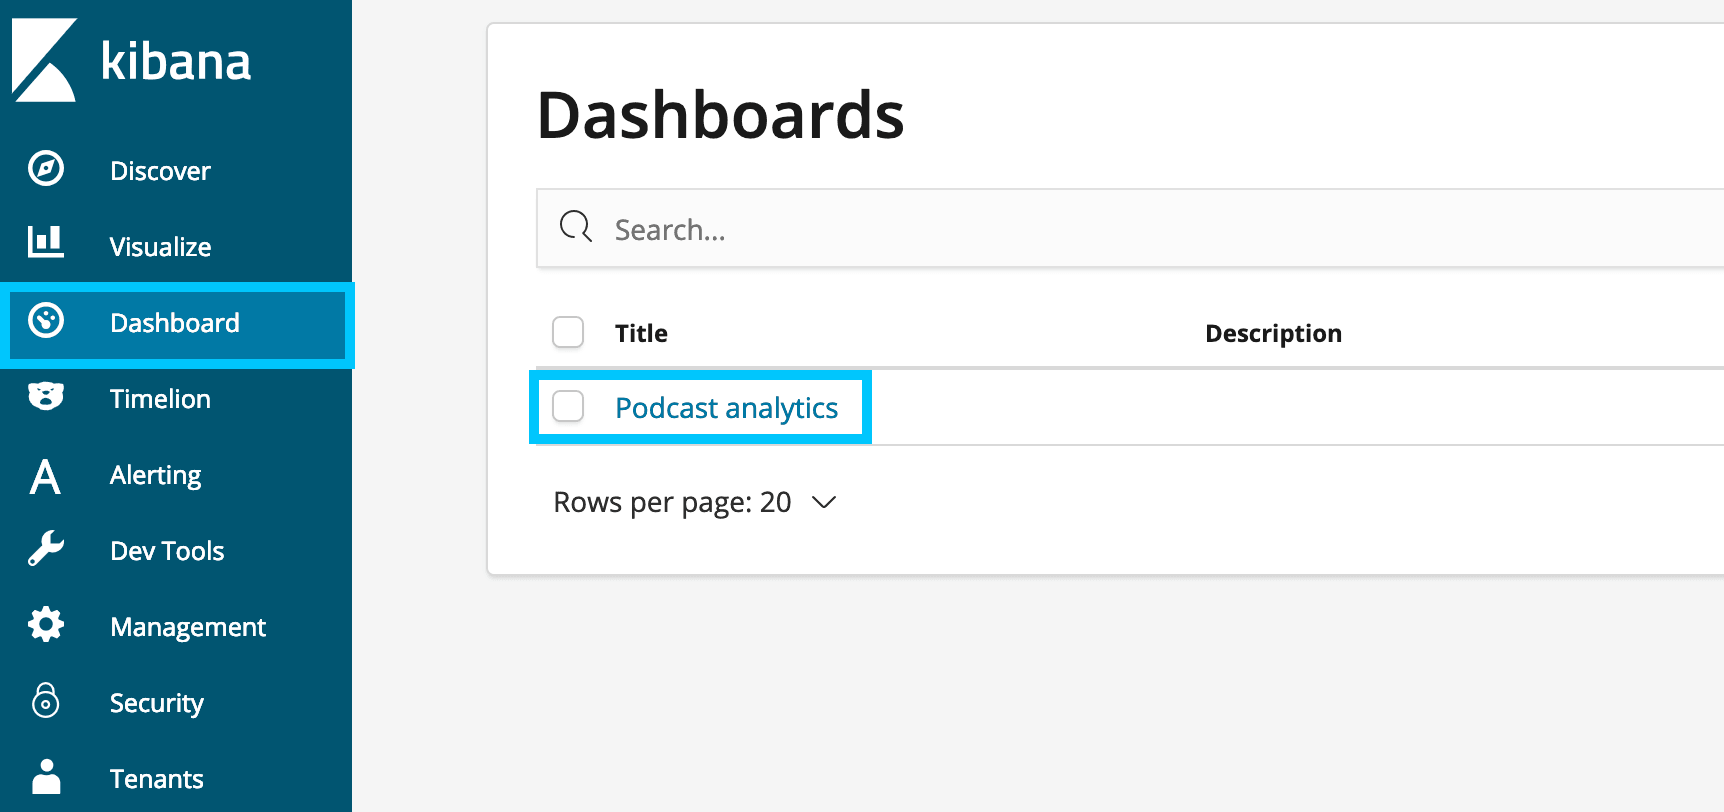
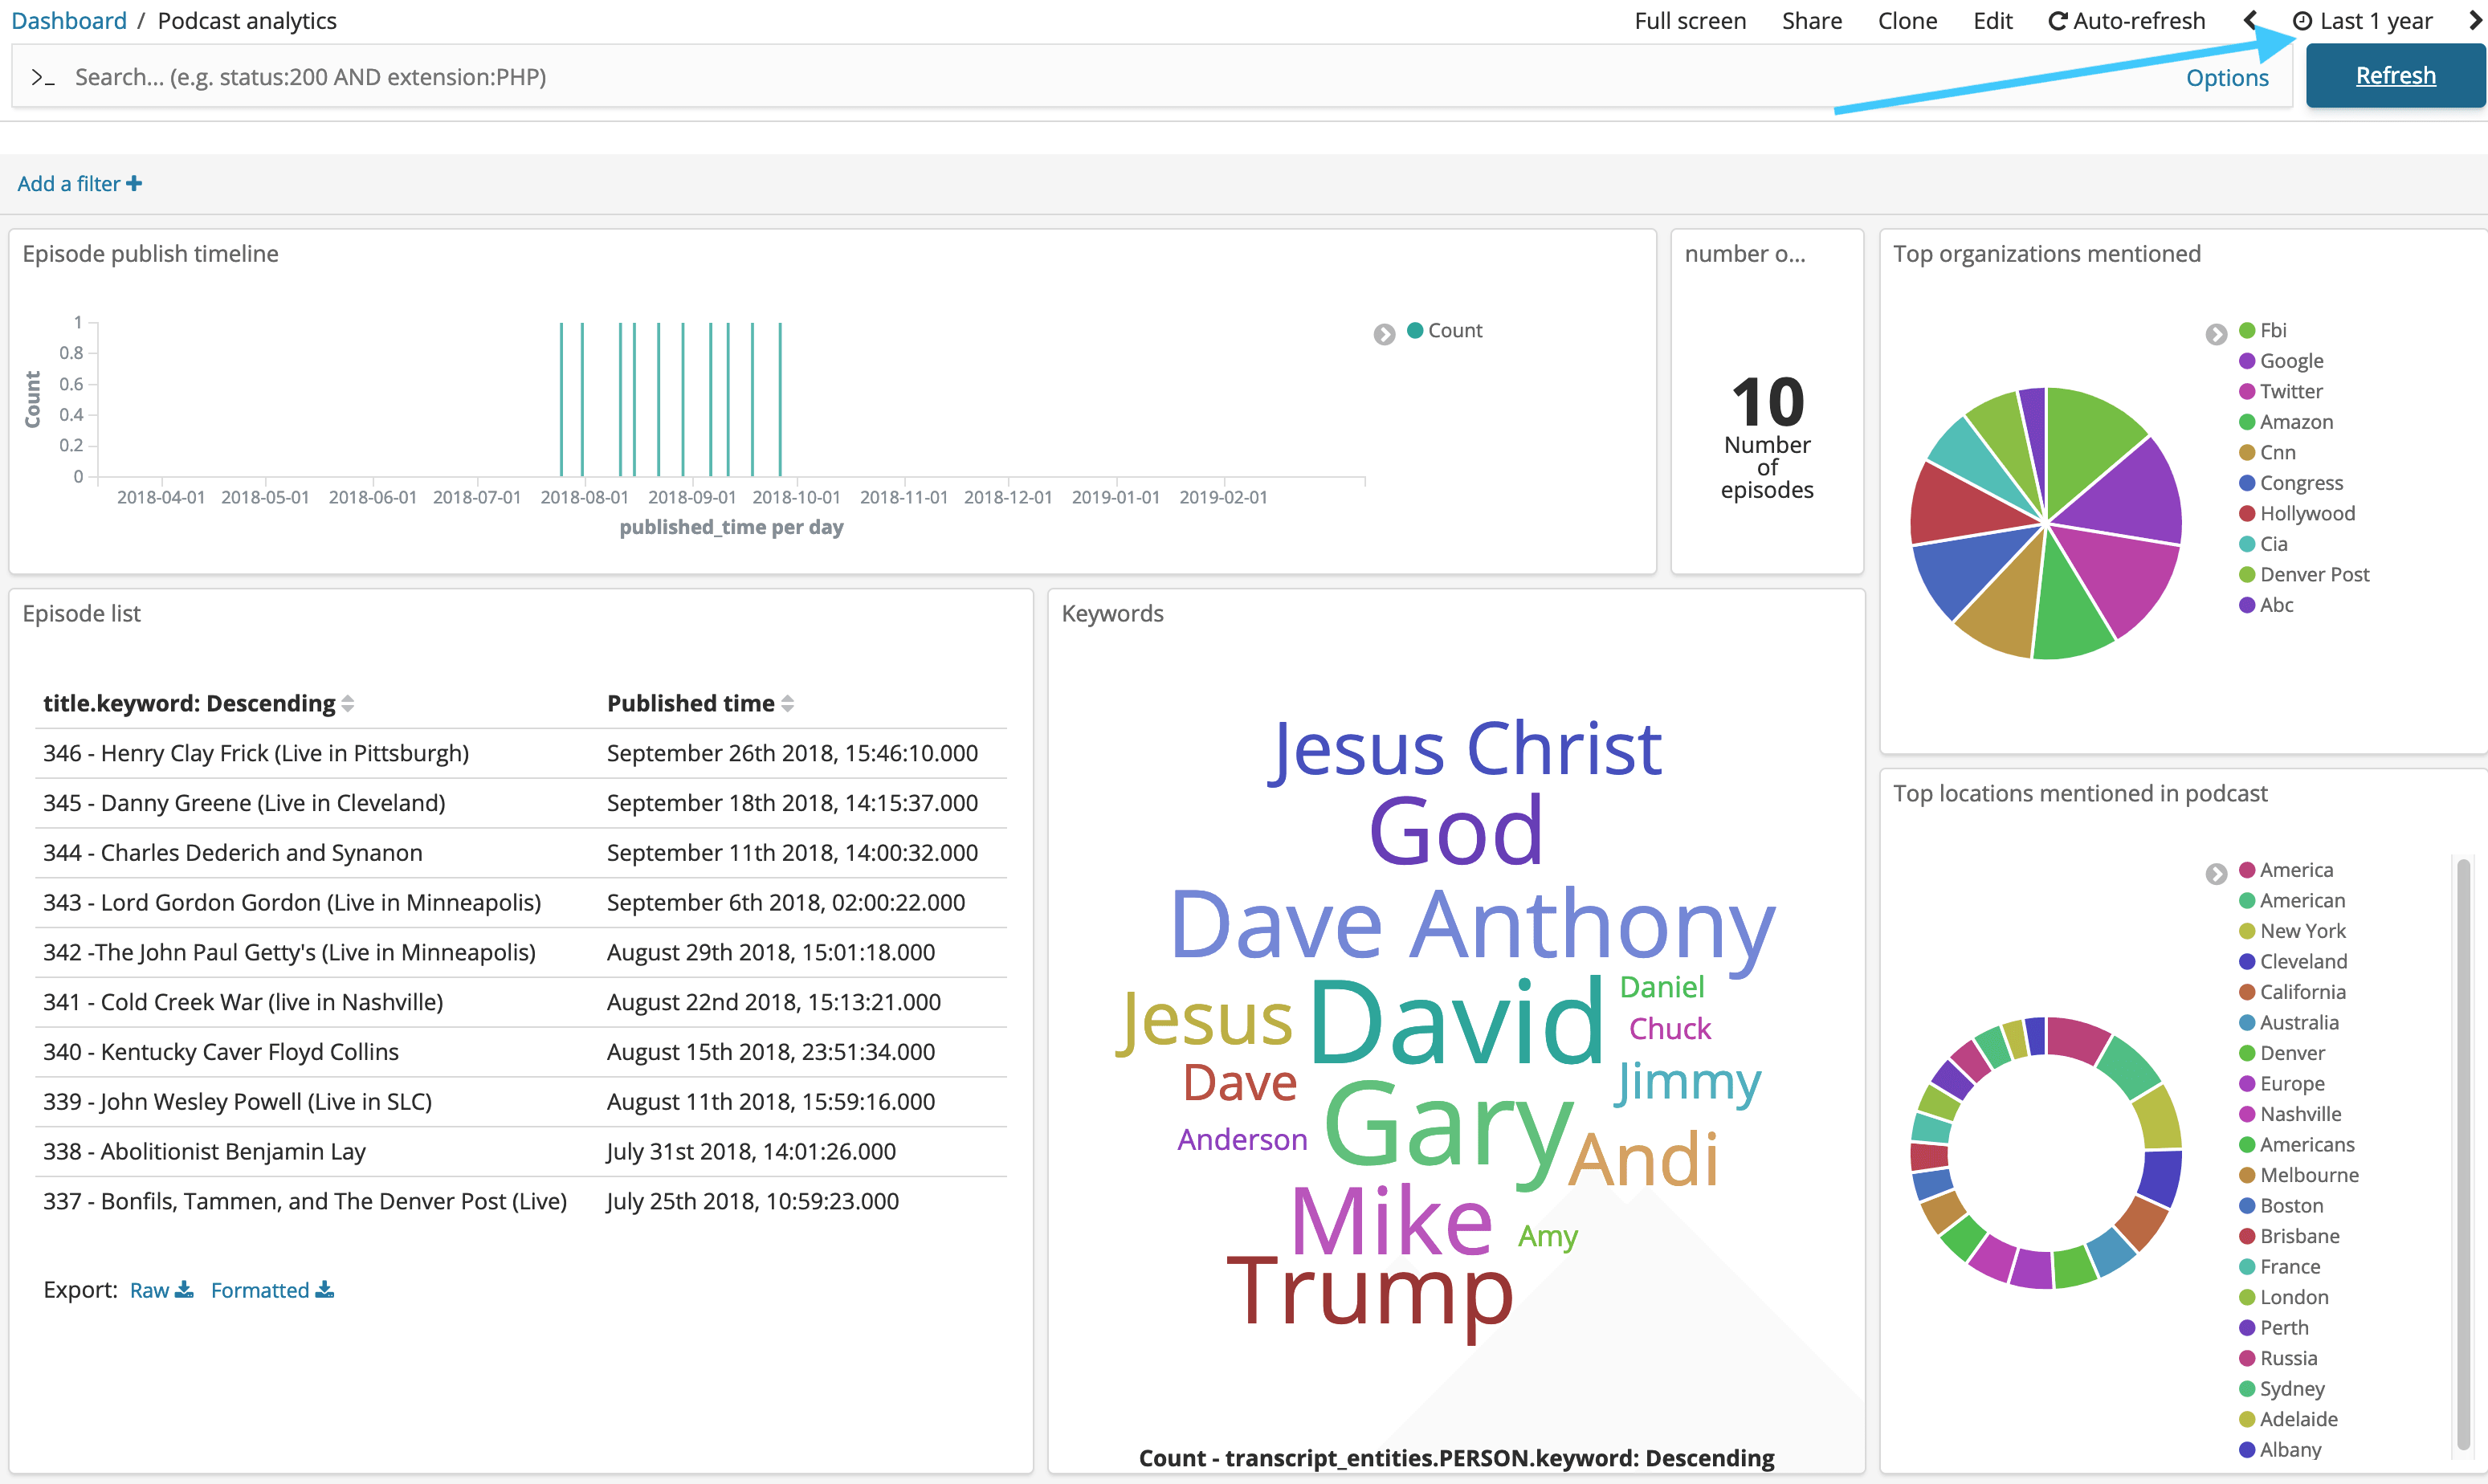
Click on Dashboard then Podcast analytics to load up the new dashboard
Finally, set the Time scale in the top right to 1-3 years ago (until you see data)
Cleaning Up
To clean up all the containers when you're done, simply run the following docker-compose command to remove all.
docker-compose down -v